Parking, Mobility, and Transportation in the Post-Pandemic World; a White Paper by Frogparking
Let’s talk about the challenges the transportation & mobility industry will face as a result of the COVID-19 pandemic
Contents:
Introduction
In the wake of
the outbreak of COVID-19 in 2020, people’s behaviour and patterns have changed in response to the virus as part of a society-wide fight to slow the spread and flatten the curve.
Many of the practices adopted during the peak of the fight against the virus are now society’s expectations, even as more people get vaccinated against the virus and places begin reopening. In other words, COVID-19 has changed the world and the way we do things forever. Businesses, cities, and households are making changes in this new world that we live in.
This White Paper uses real data and insights from across the mobility and transportation industry in the last 18 months to give providers of parking context about the size and scale of the challenges on the horizon, and highlight the ways the parking experience needs to adapt.
It’s always easy to point out the problems, but not everyone can talk about solutions. That’s why this White Paper not only seeks to point out the challenges providers of parking will face, but will also offer solutions. Many new terms, practices, and ways of doing things have become the norm in an attempt to fight the virus.
There’s a lot of data out there at the moment, from a range of sources. Our aim with this White Paper was to pull it all together to show providers of parking at all sizes and scales that the industry needs to change and adapt with COVID-19 friendly ways of interacting with their customers.
Surveys & data
There has been an unprecedented decrease in the use of public transport as a result of the COVID-19 pandemic across the whole United States of America.
And the data collected from regular users suggests that this will never recover to pre-pandemic levels.
Recent surveys conducted by public transit authorities and data collected by Google from their users shows a trend that should concern providers of parking.
However, if you look at the reasons why people are avoiding public transit, there are some clues for people in the parking industry about changes that can be made to parking as a product that makes a journey more seamless in the post-COVID-19 world.
The Data:
Northern California
The California Transit Association
In Northern California, The California Transit Association conducted a survey of a random sample of the most frequent Bay Area Rapid Transit (BART) users in the San Francisco Bay Area.
53% of the respondents said that they will either reduce or stop riding altogether, even once fully vaccinated,
- 53%
with a further 69% saying the reason was based on public health concerns.
- 69%
46% of users who used services provided by the Santa Clara Valley Transportation Authority, who deliver light rail, bus, and paratransit services for commuters, more than once a week said that they were highly unlikely to ever return to public transit following the pandemic.
- 46%
The same is true in Southern California.
A survey of all regular users of Metrolink, Los Angeles’ commuter rail service revealed that:
Southern California
The California Transit Association
Metrolink Users Surveyed
%
would either reduce their frequency travelling to under 1 day a week or stop altogether.
Data from Google COVID-19
Community
Mobility
Reports
%
Decrease
Data from Google COVID-19 Community Mobility Reports shows that, even as California eases COVID-19 restrictions in 2021 and people return to public places like restaurants, cafes, shopping centers, grocery stores, national parks, beaches at pre-pandemic levels, usage of transit stations is down around 40% compared to pre-pandemic levels.
Insights in the Google Mobility reports are created with aggregated, anonymized sets of data from users who have turned on the Location History setting on their Google Device or account. Each Community Mobility Report is broken down by location and displays the change in visits to places like grocery stores and parks by millions of users.
A 2020 survey
Global
Public
Transport
Report 2020
A 2020 survey titled “Global Public Transport Report 2020” looked at the travel habits of the entire populations of 104 cities in 28 countries.
Respondents in Los Angeles and the San Francisco Bay Area showed clear trends:
46% would like to pay for public transportation rides by a contactless mobile app.
- 46%
36% would like to know in advance which vehicles were crowded,
- 36%
28% would like to be notified by mobile app which vehicles had been disinfected recently.
- 28%
It’s clear that there is a new reality
when it comes to people’s mobility.
Private vs
Public
Transport
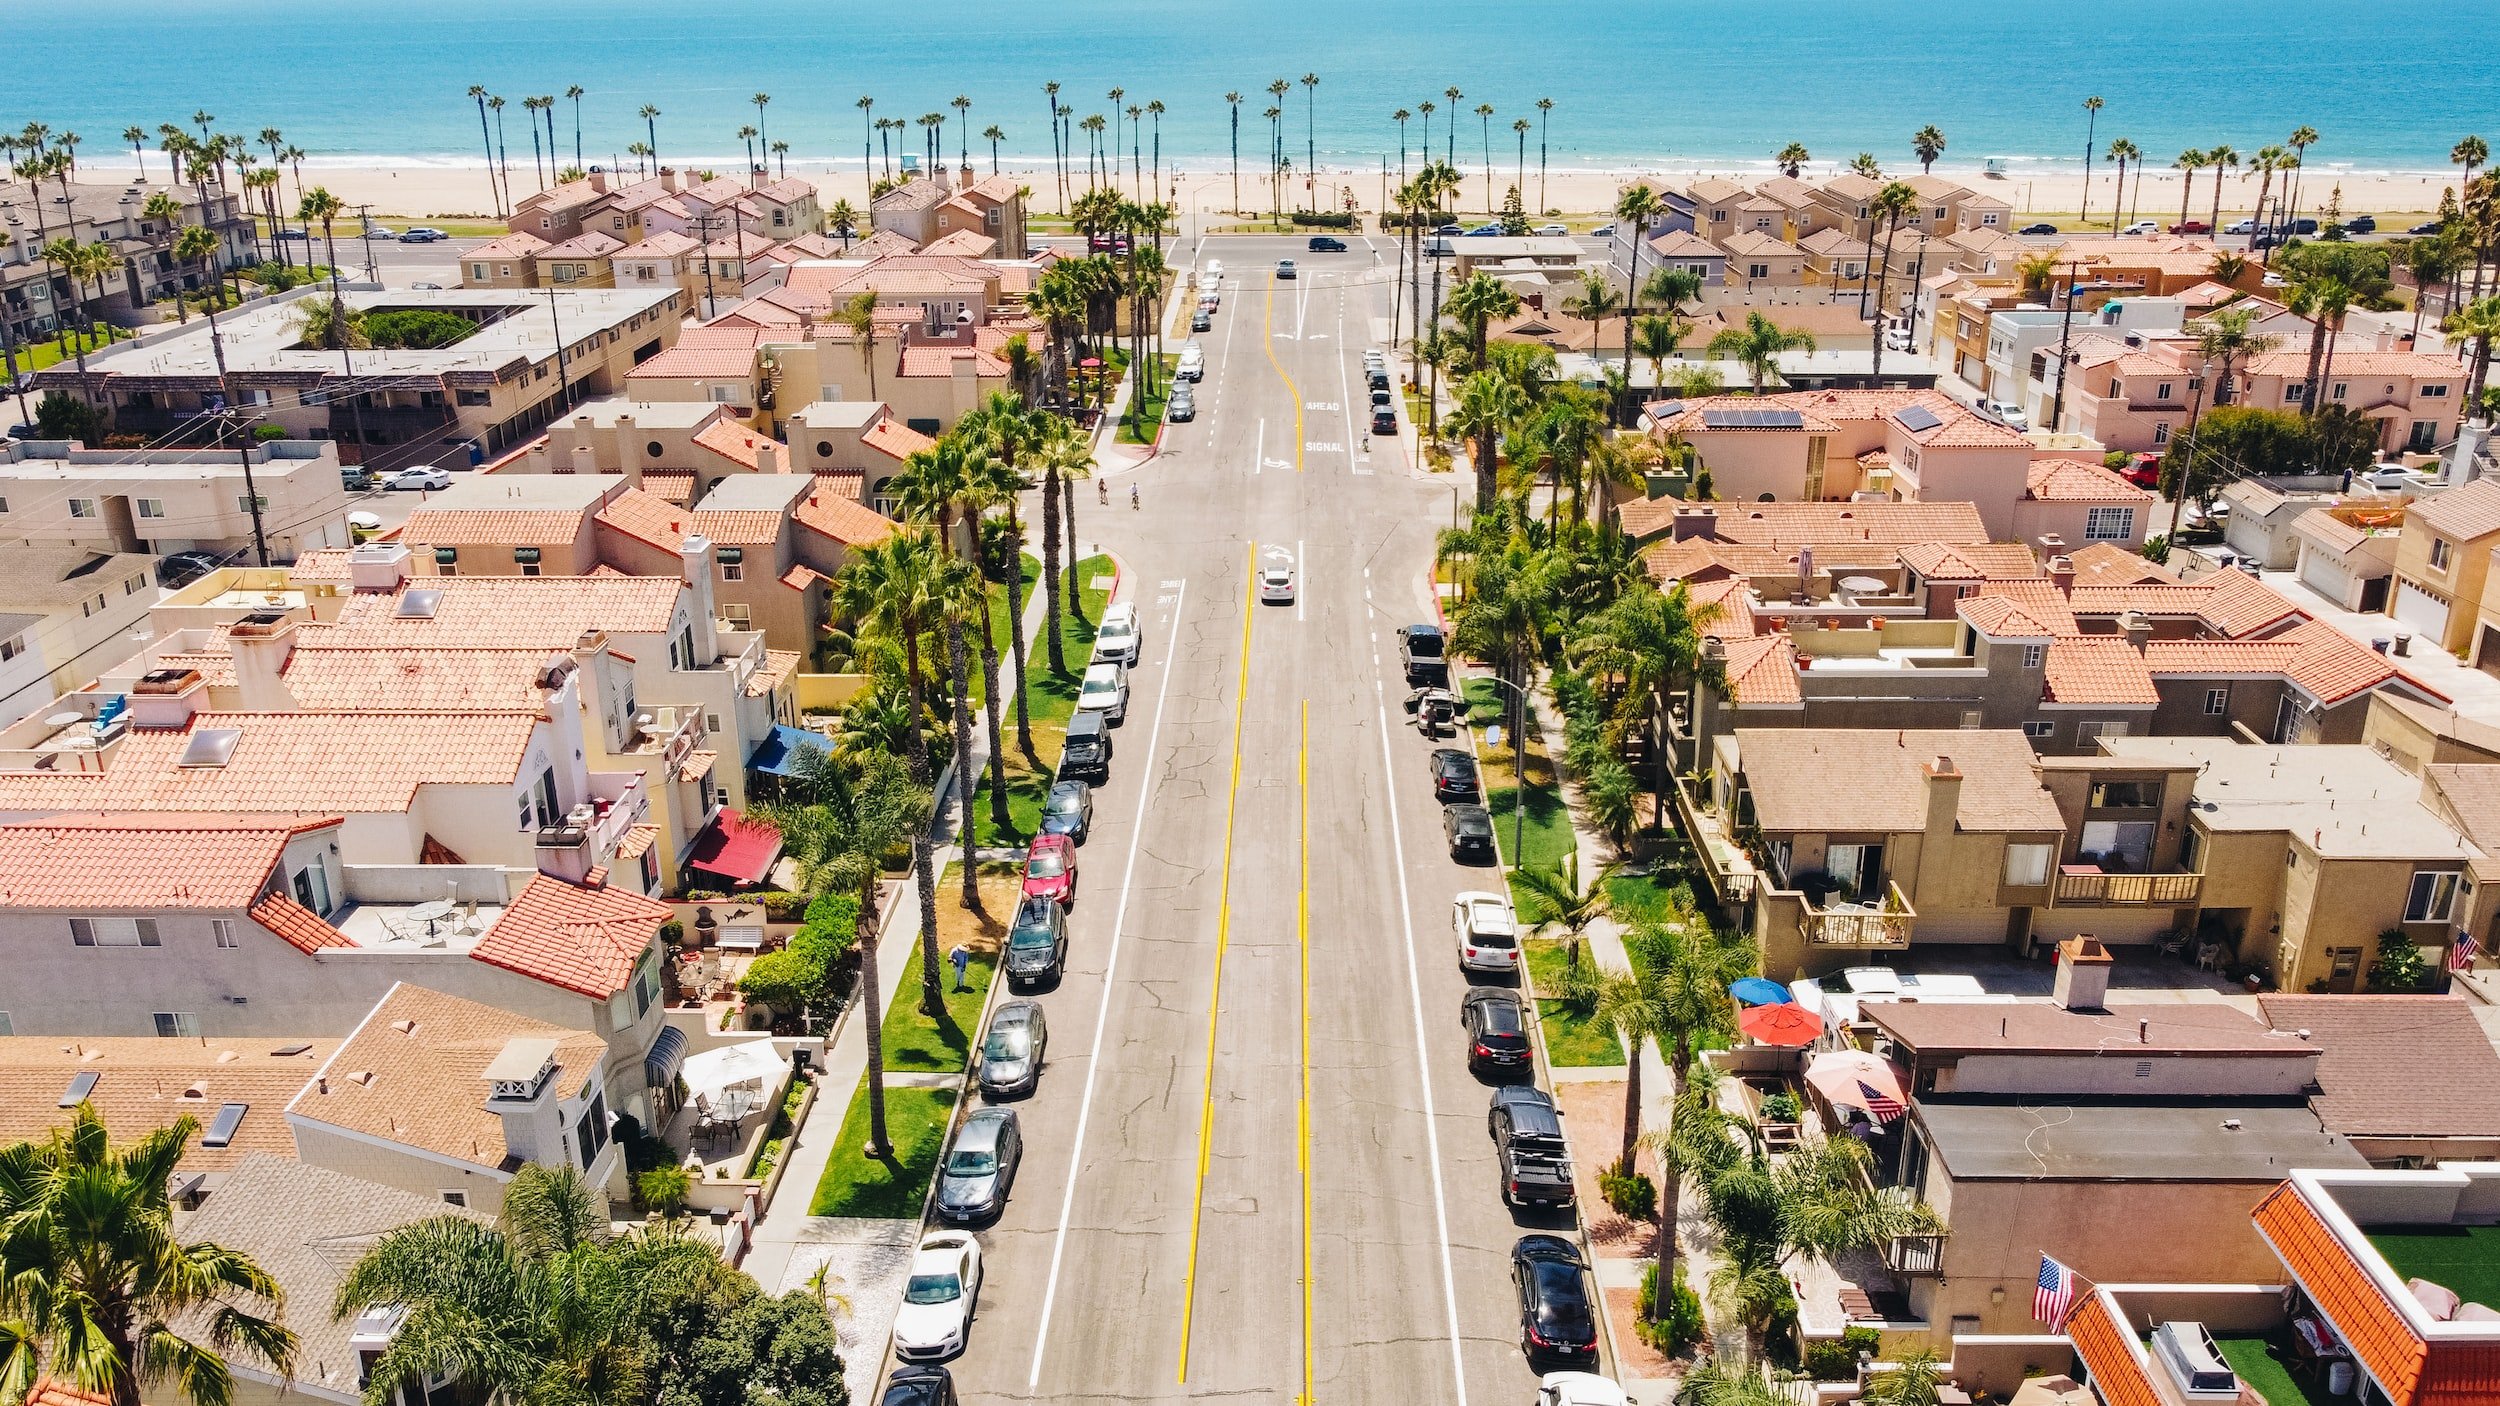
California is one of the world’s biggest markets for private vehicles
with urban development based around the wide-spread usage of cars; but it’s always been supported by a reasonably high usage of public transport.
Why are cars more popular in California compared with other parts of the United States? Particularly, for example, the East Coast of the USA.
In short, it’s cultural.
Freedom
Cars, or private transport more broadly, are associated with freedom. Freedom of movement, not being restricted by the rigid schedules of public transport, and the freedom to go from point A to point B without needing to adhere to the locations where public transport stops.
Road Connectivity
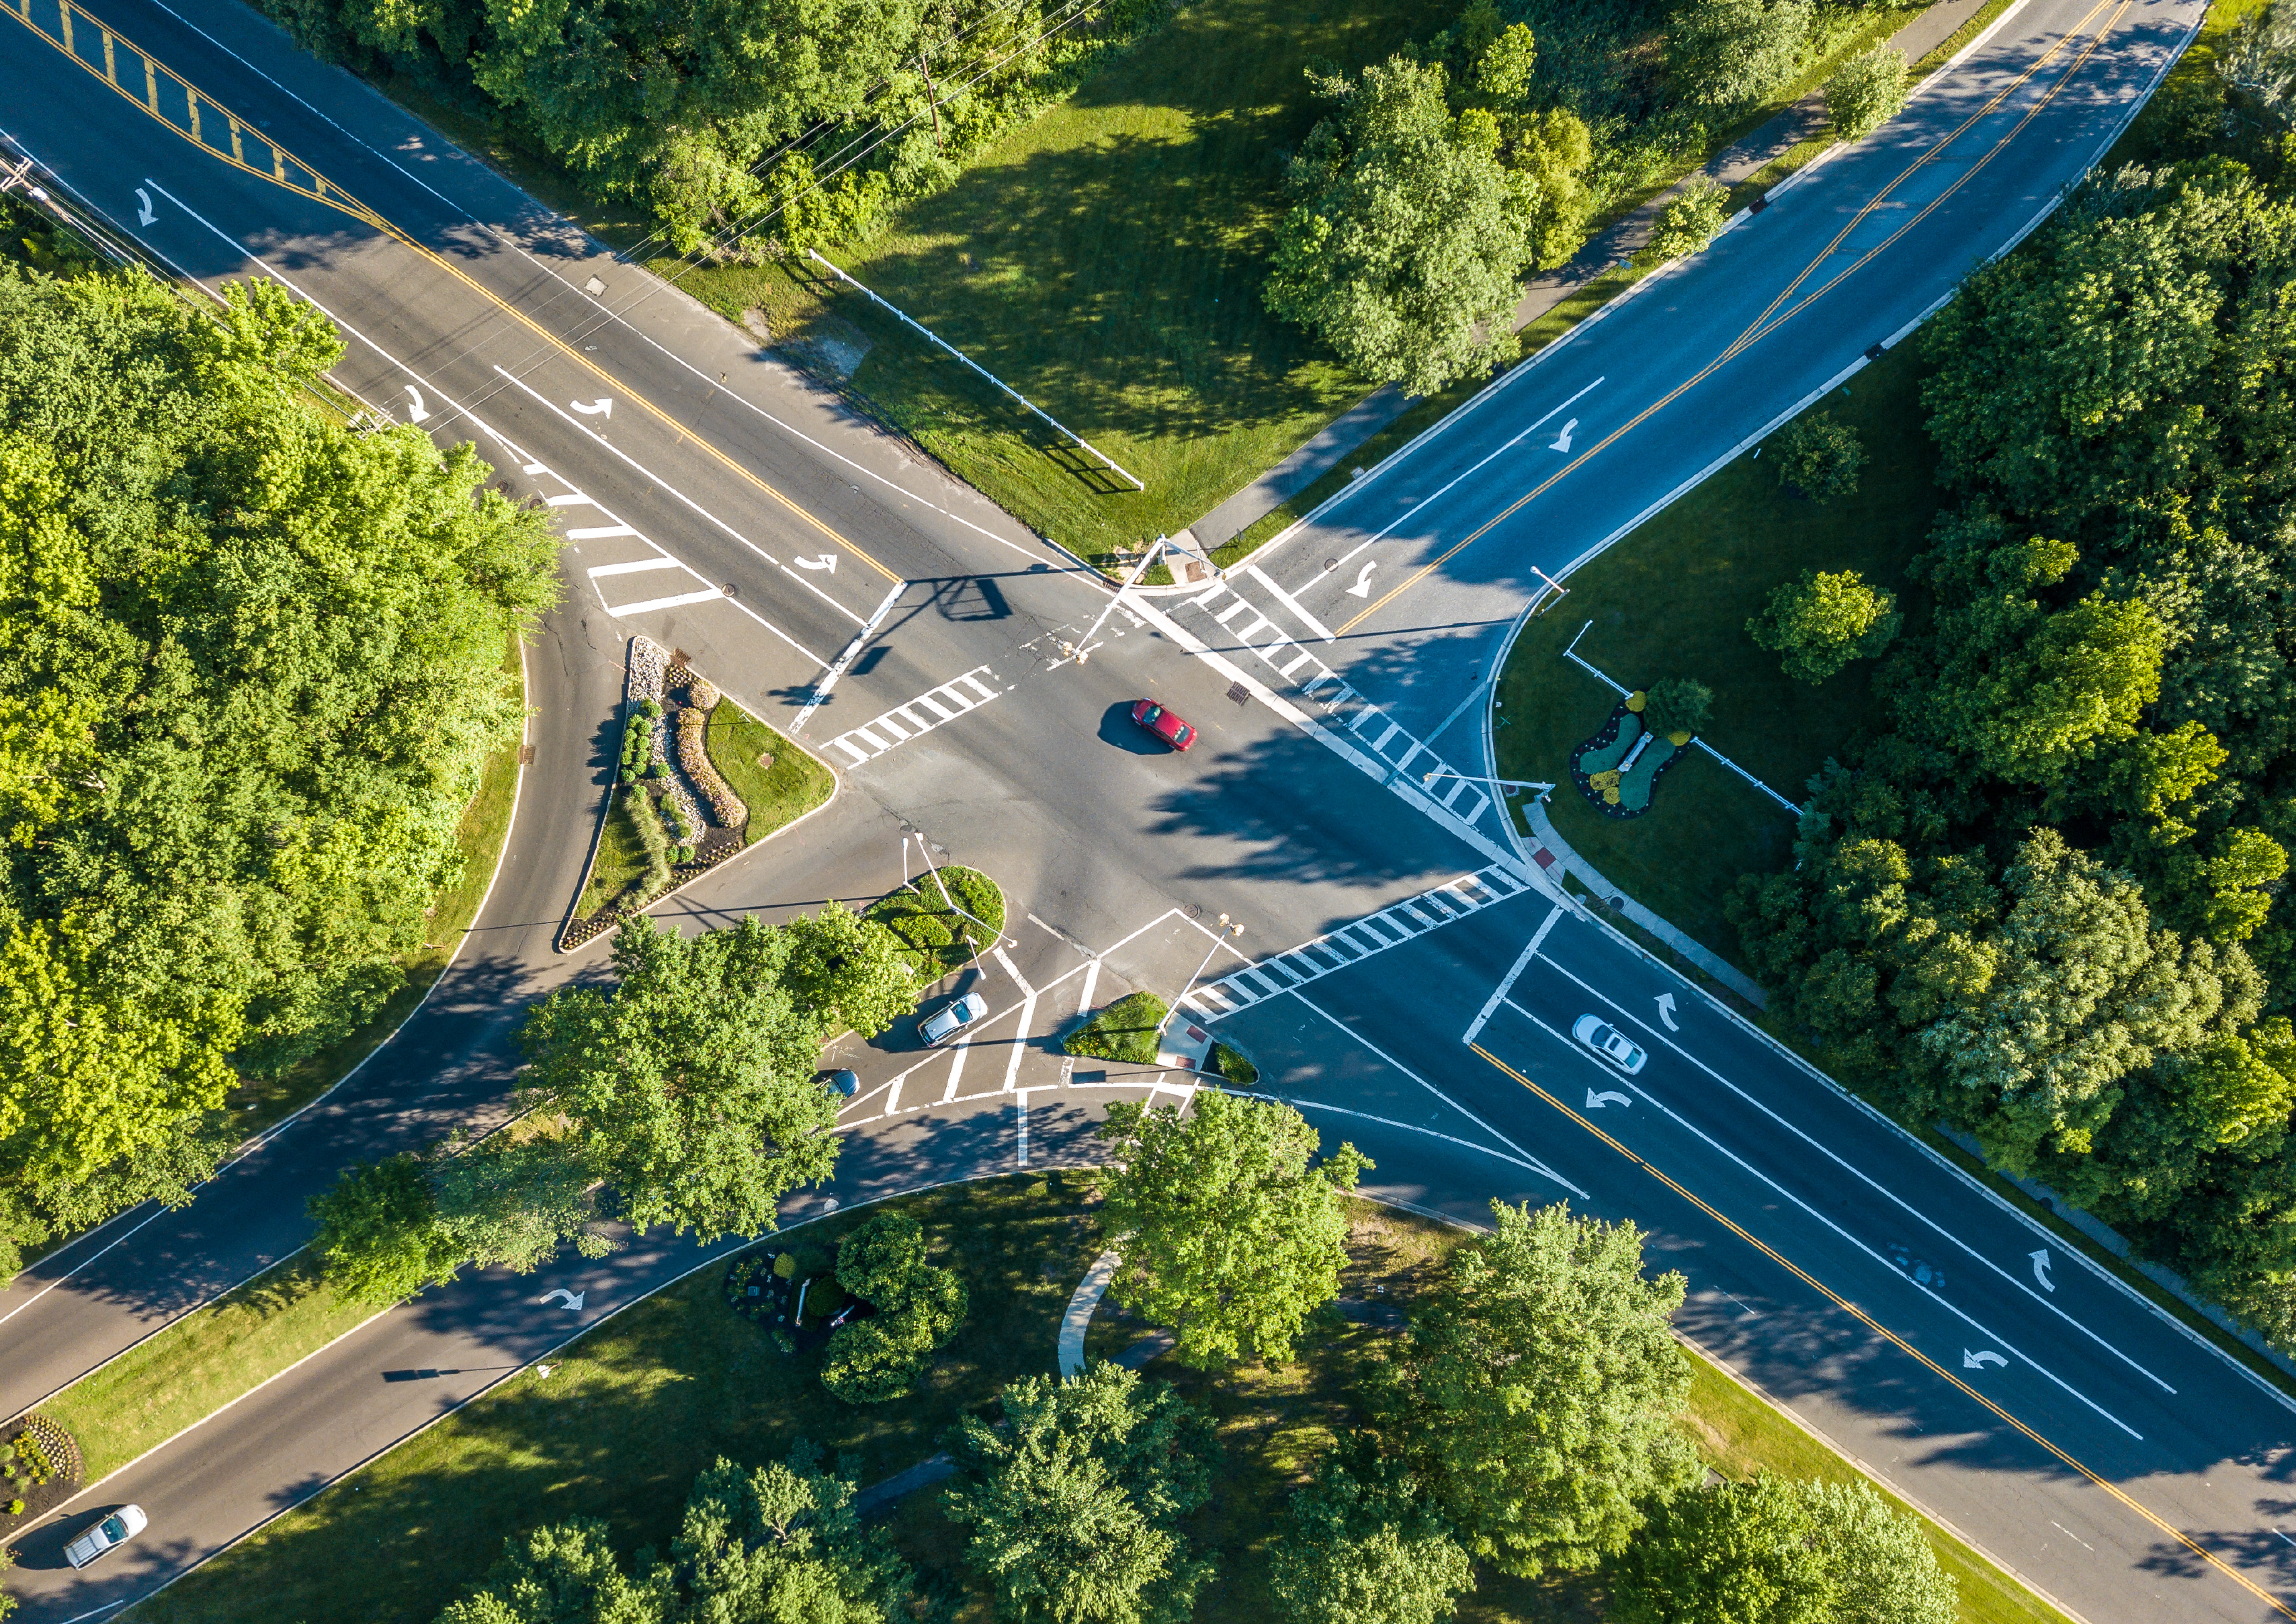
Los Angeles, being a relatively modern city, went through much of its development as a large urban area following the mass adoption of private motor vehicle, meaning people could be connected based on the connectivity of roads, unlike the older East Coast cities connected by rail lines.
Roads & Freeways
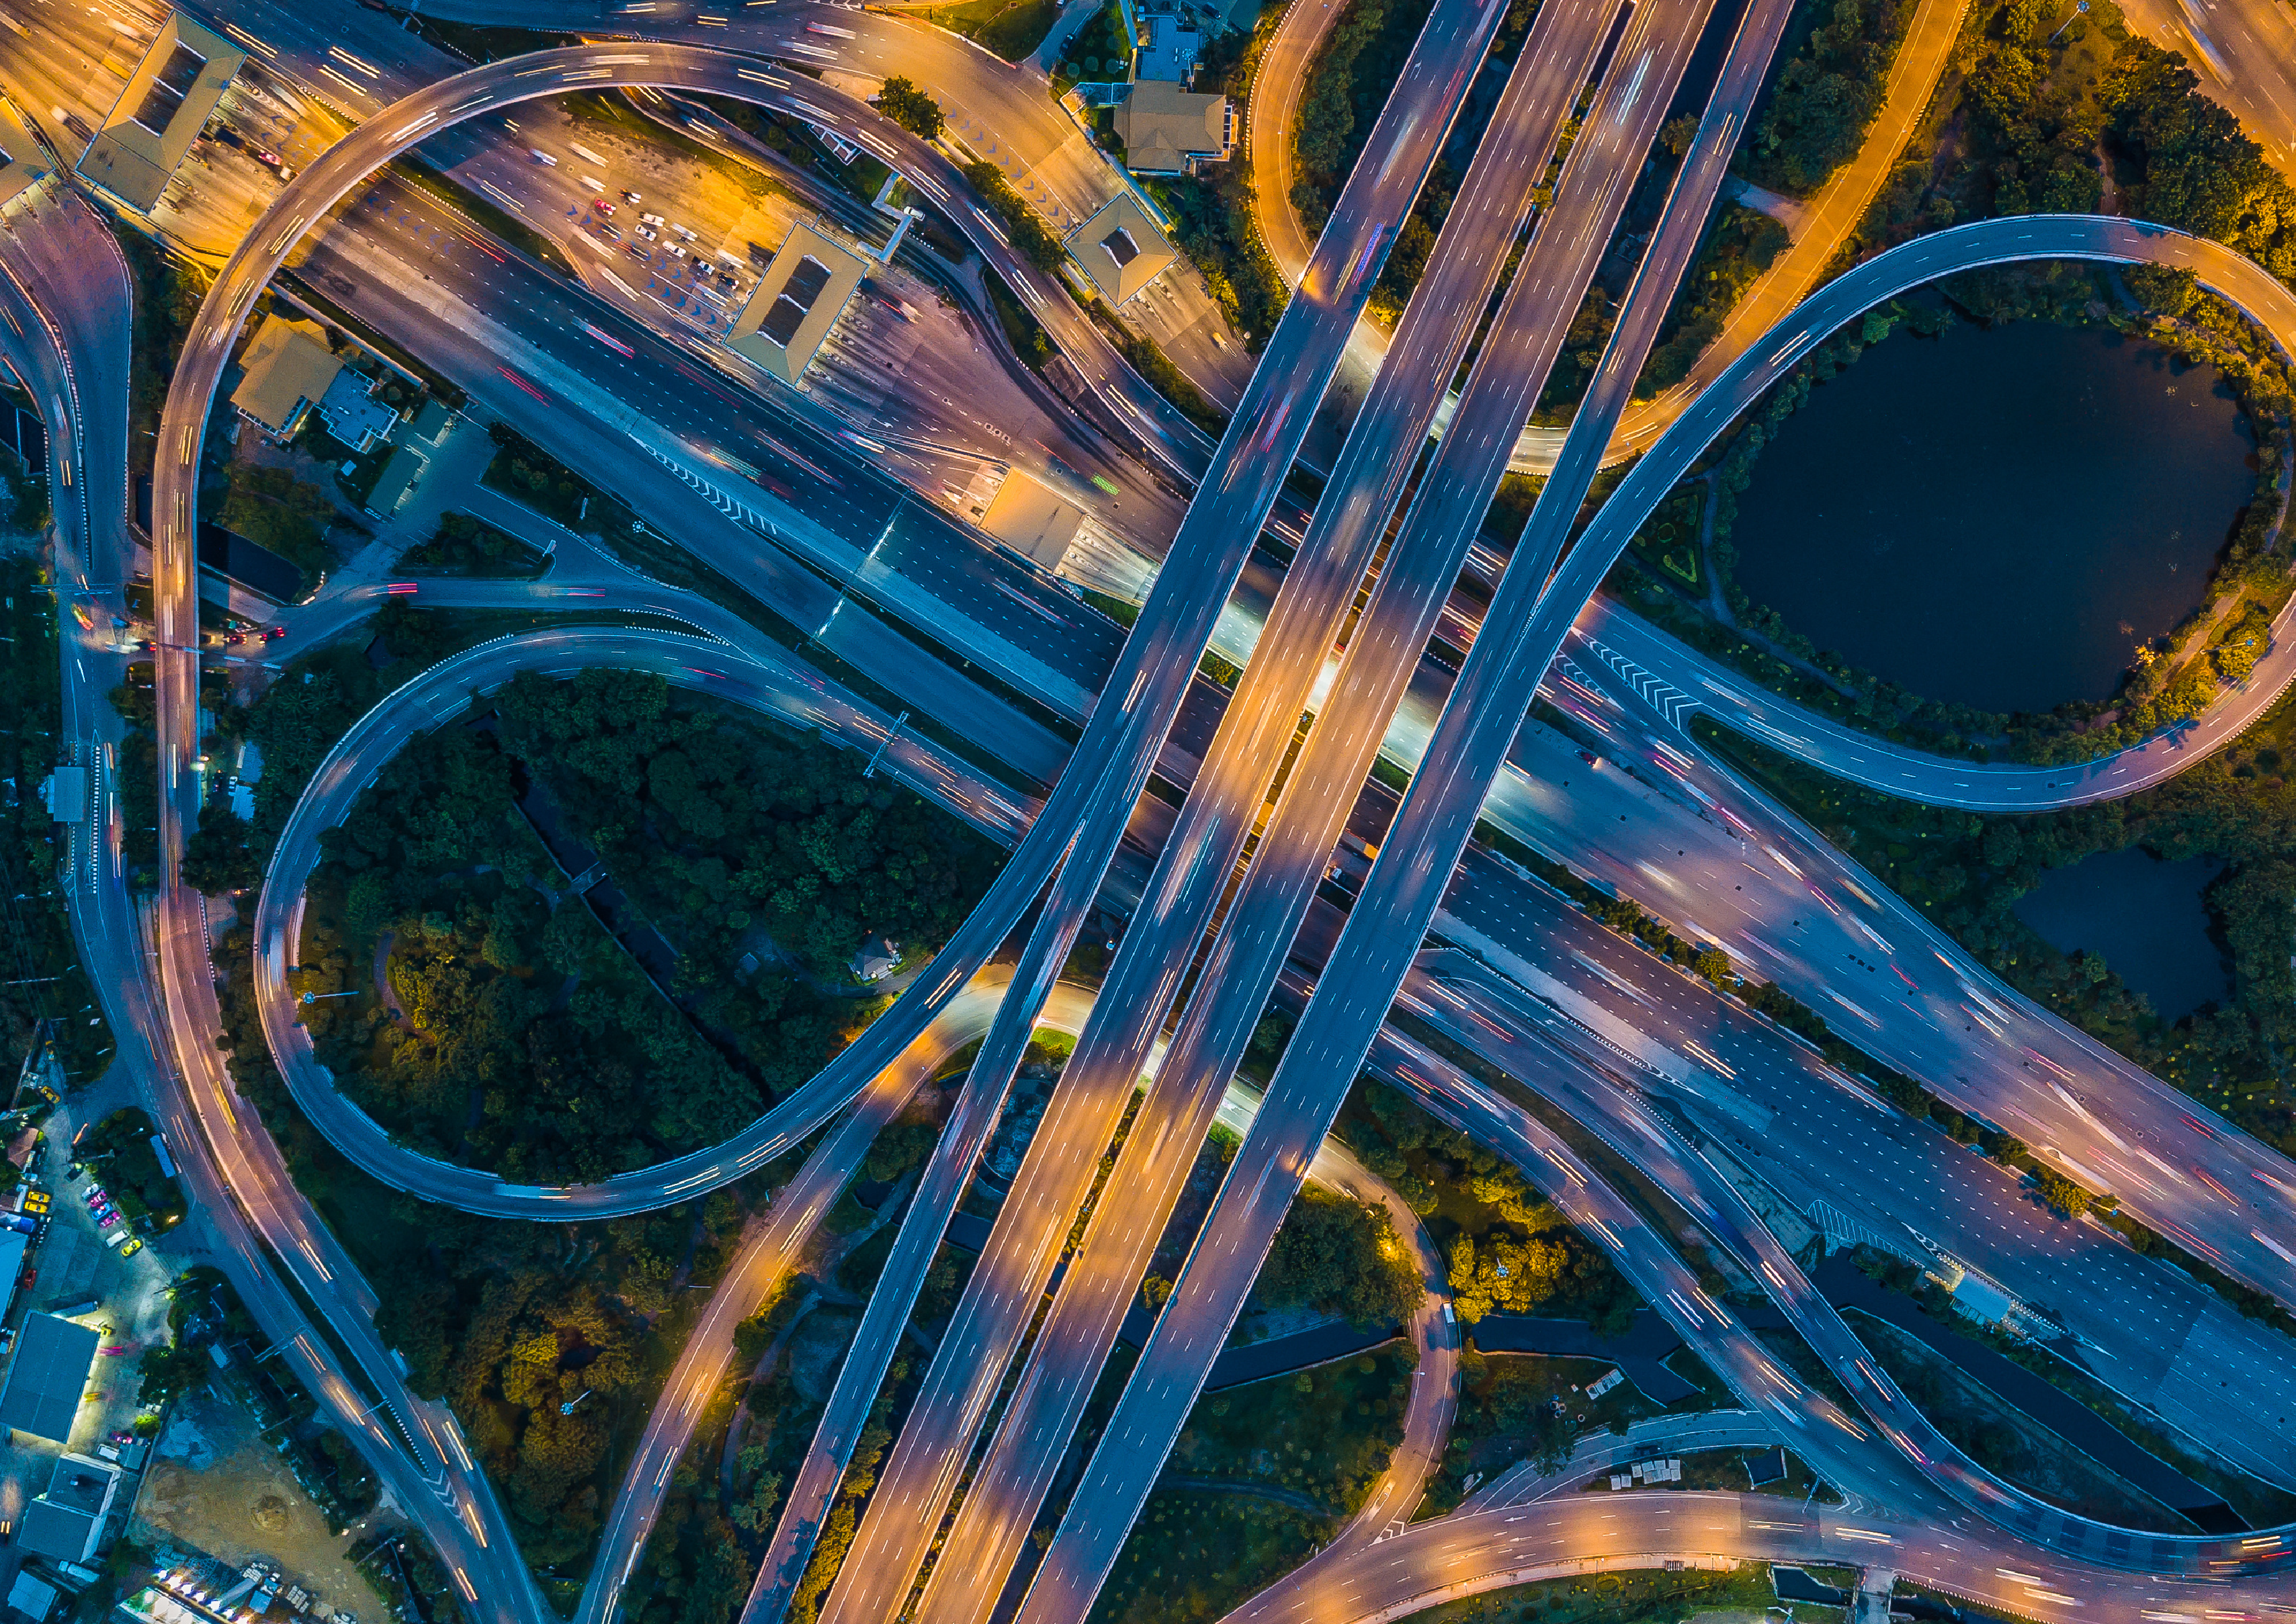
Ultimately for California, but Los Angeles especially, this dependence on the car has led to large, sprawling cities, connected by roads and freeways, with public transport lower in priority, because people are connected on a more ad-hoc basis
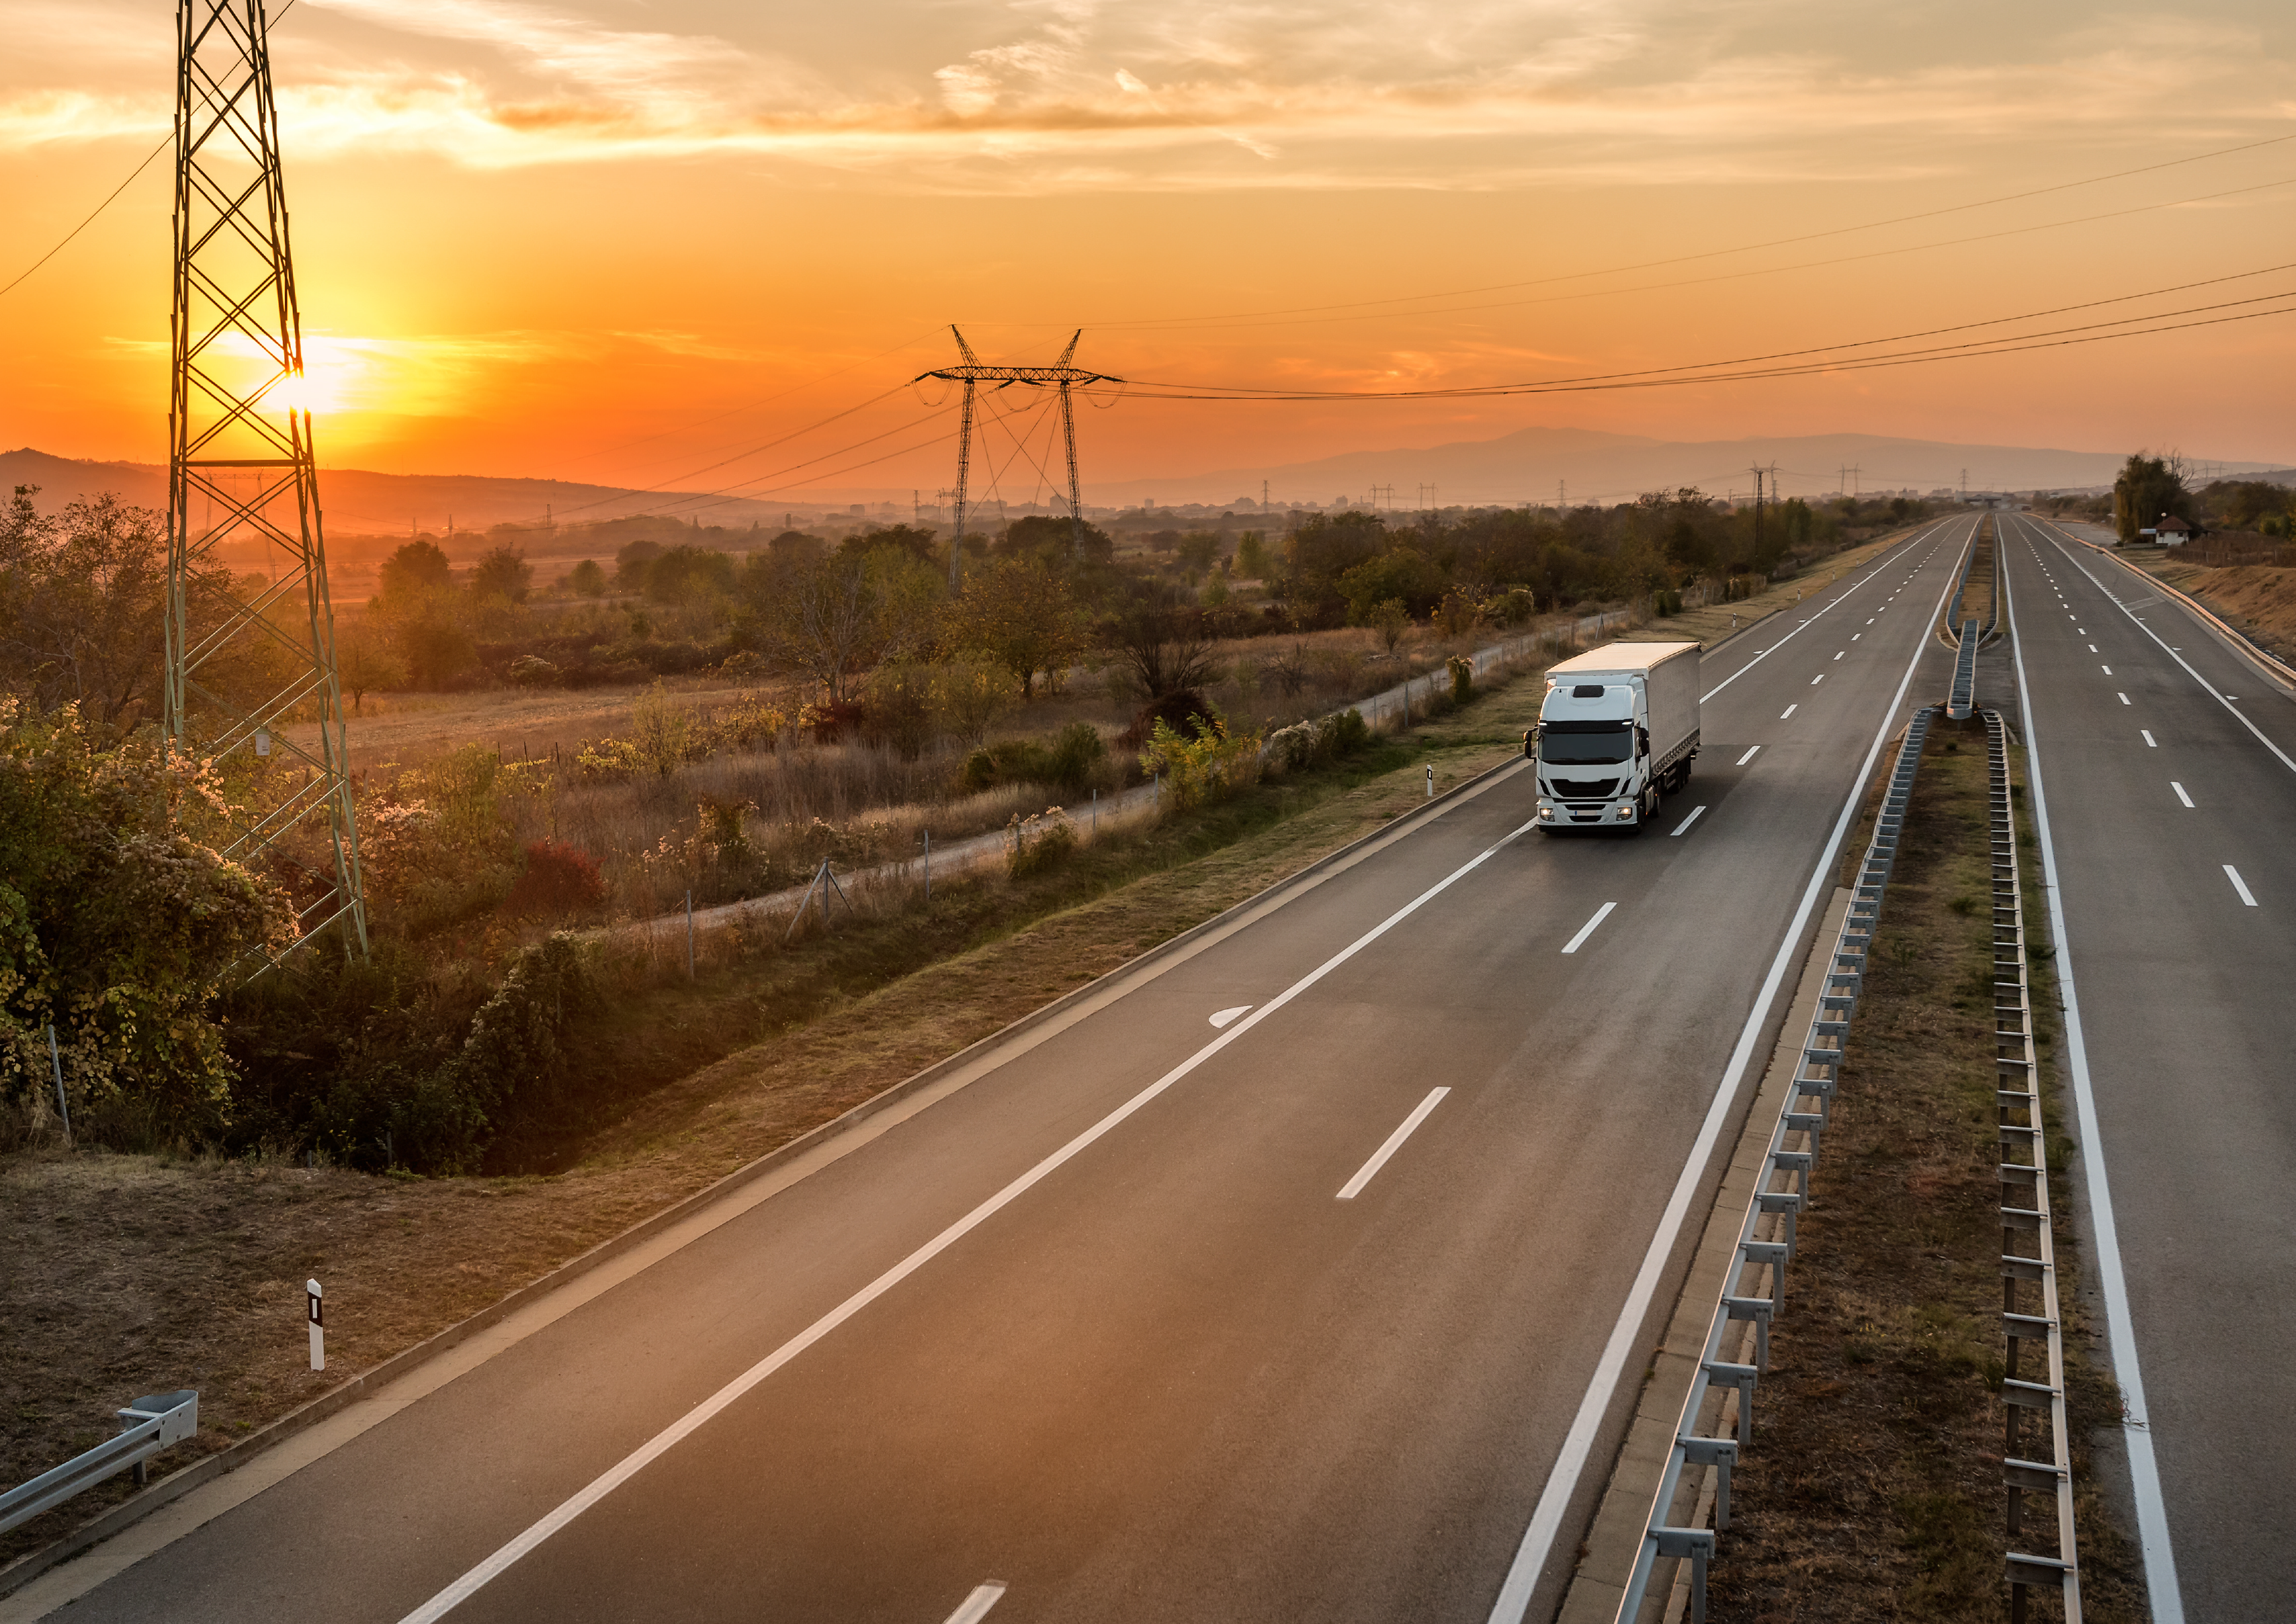
Highway Cruising
TV, music, and film, of which a large proportion is based in Hollywood, have also romanticised and created a culture around private vehicle ownership on a scale not seen in many other places in the world. Cliché scenes of drivers cruising down the Pacific Coast Highway.
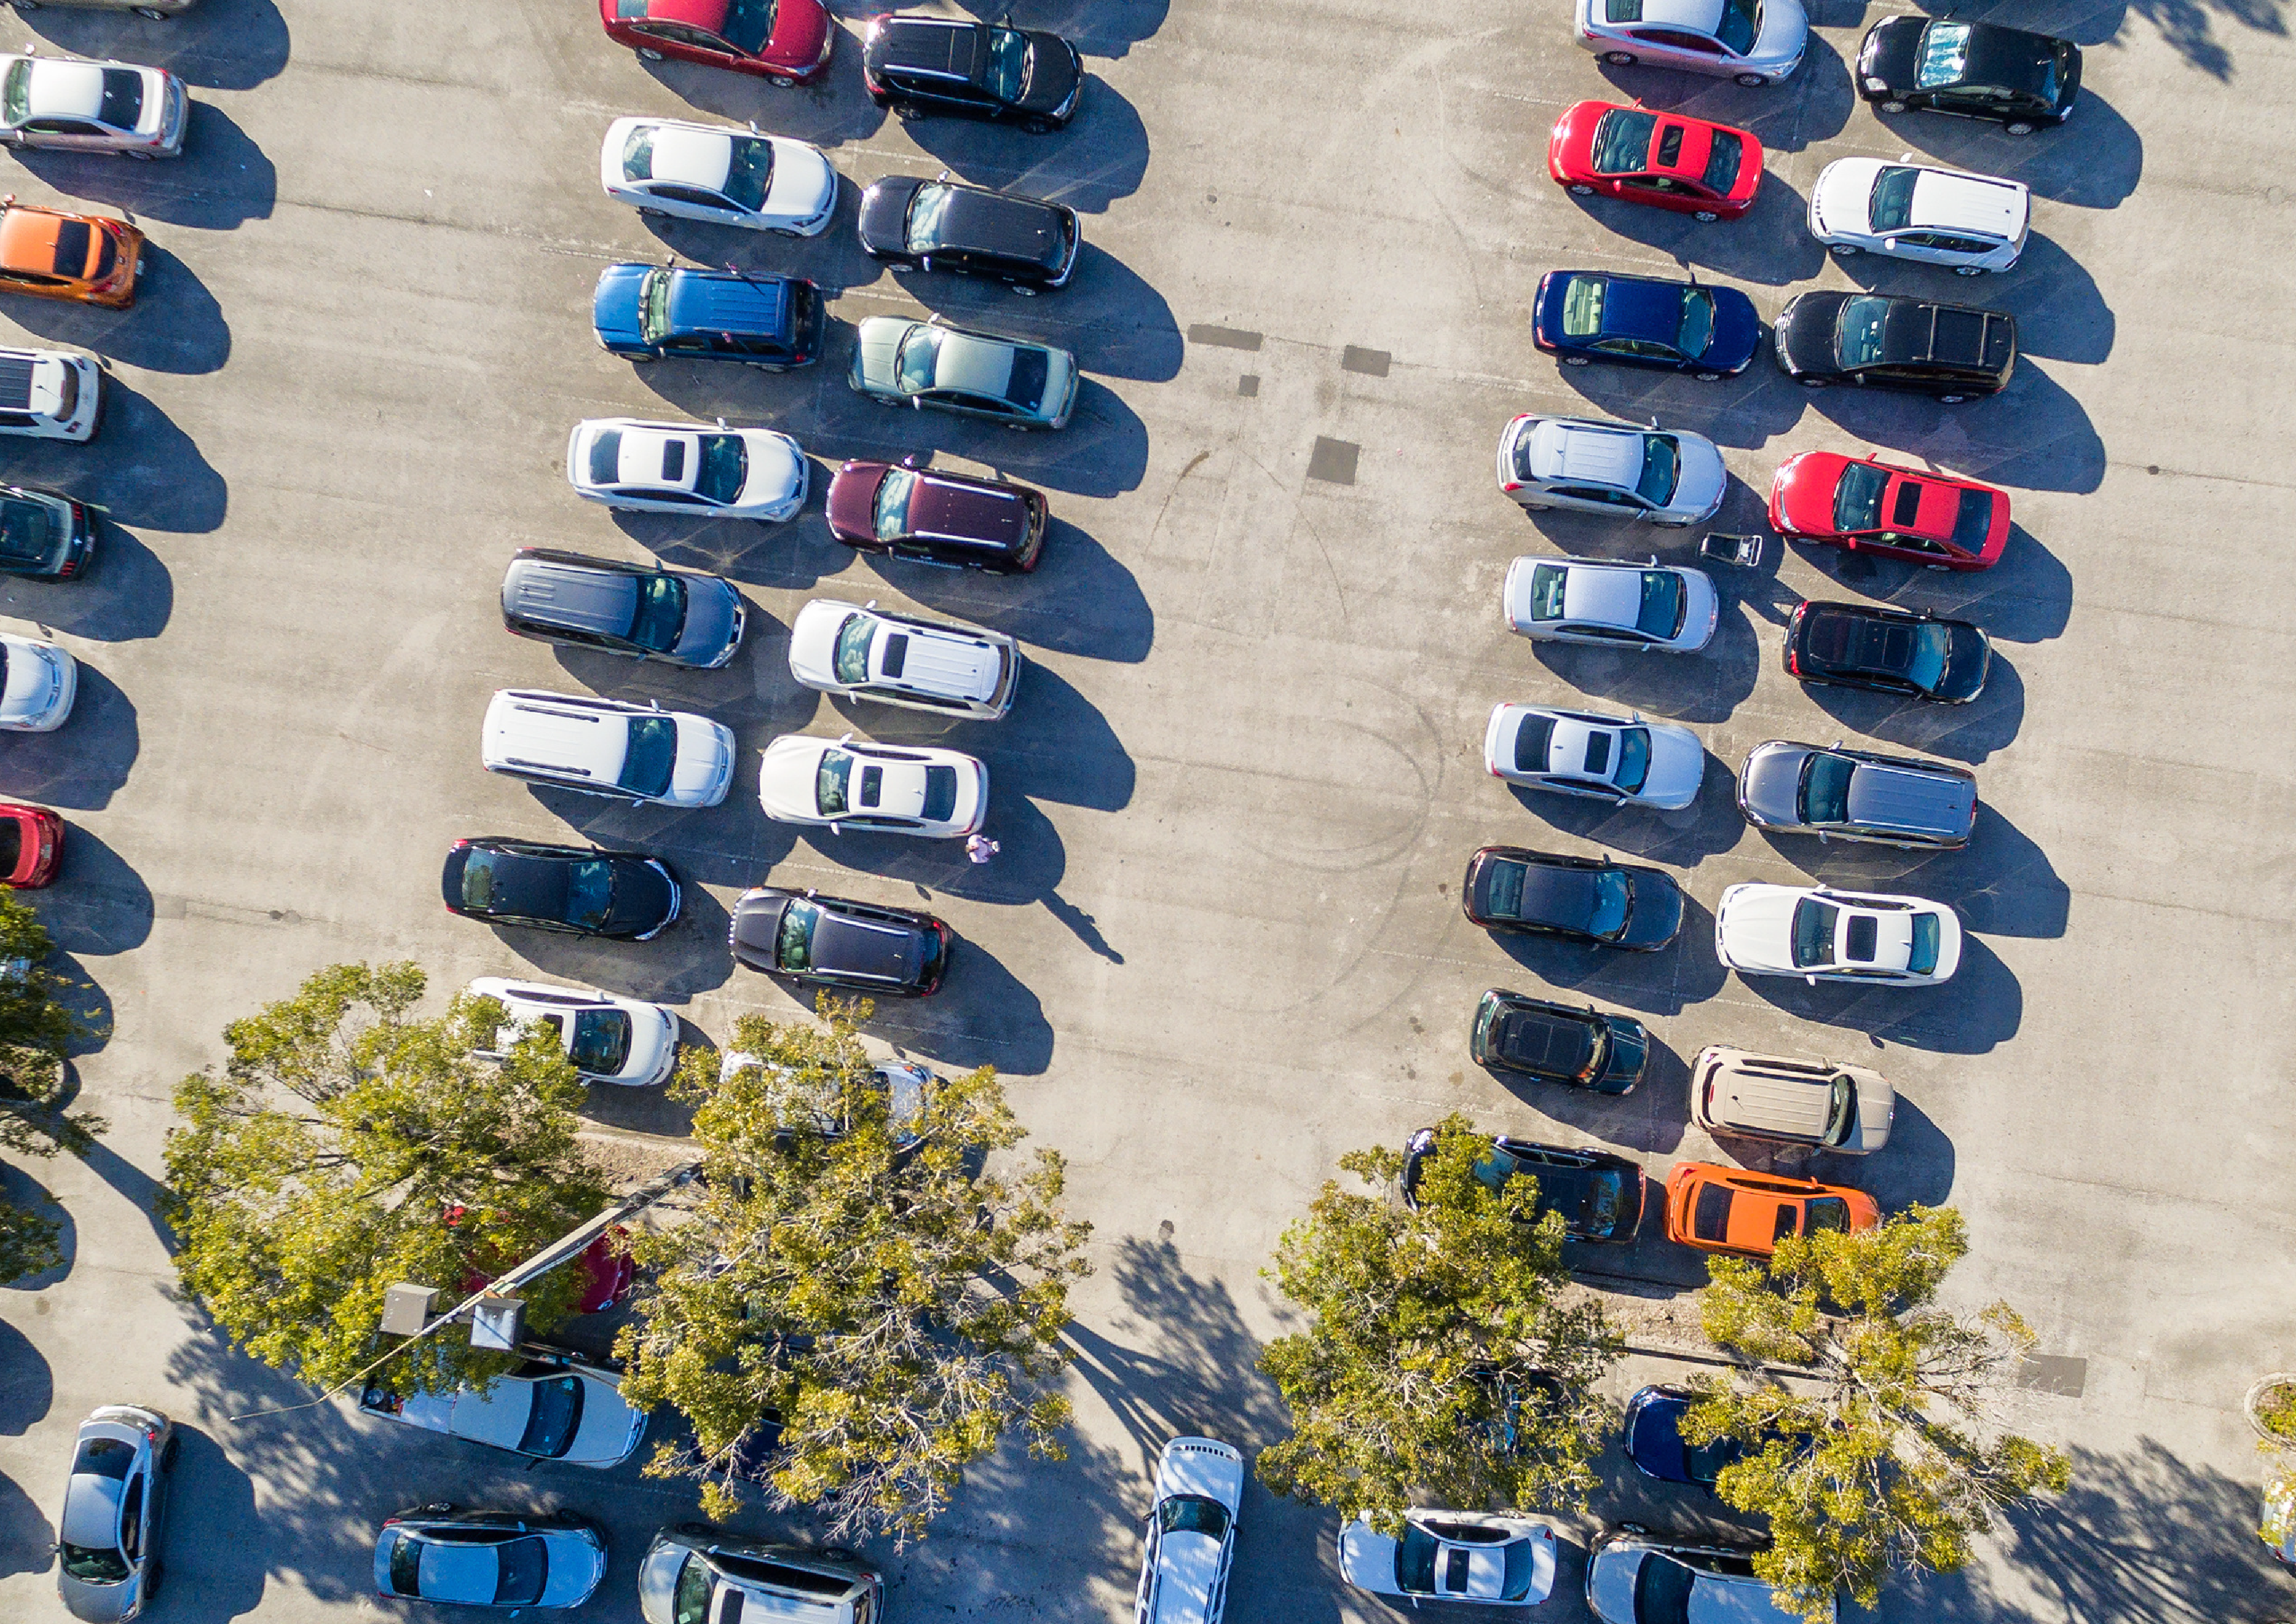
Car Dominated
Yes it’s true that California and Los Angeles in particular has always been a car-dominated state, but it’s always been supplemented by a reluctant percentage of the population who have caught public transit.
In pre-pandemic 2019, Los Angeles-Long Beach-Anaheim and San Francisco-Oakland led the way in hours spent in congestion per year in the United States of America.
Even with public transit use at normal California levels pre-pandemic,
Los Angeles-Long Beach-Anaheim drivers spent 119 hours, nearly 5 days in congestion
While those in San Francisco-Oakland spent 103 hours, or over 4 days, in congestion.
So what does
this all mean?
Change and a
new normal.
The way we move has changed forever. Just as the way we interact with public spaces and the people around us has. In the space of 18 months, we’ve all become arm-chair epidemiologists, we are now hyper aware with phrases like bubble, contactless, contact tracing, and sanitize part of our everyday life

California is reopening.
Stay at home orders are lifting and the data shows us that there is a desire to get out and about after a long period of time being stuck at home and people are returning to public places. It won’t be long before more and more people are vaccinated and visits to public places return to pre-pandemic levels.
Unlikely return.
Post-pandemic and data from surveys of Californians who used public transport before are saying that they’re unlikely to return to it because of fear for public health and a lack of contactless options to pay and a lack of social distance.
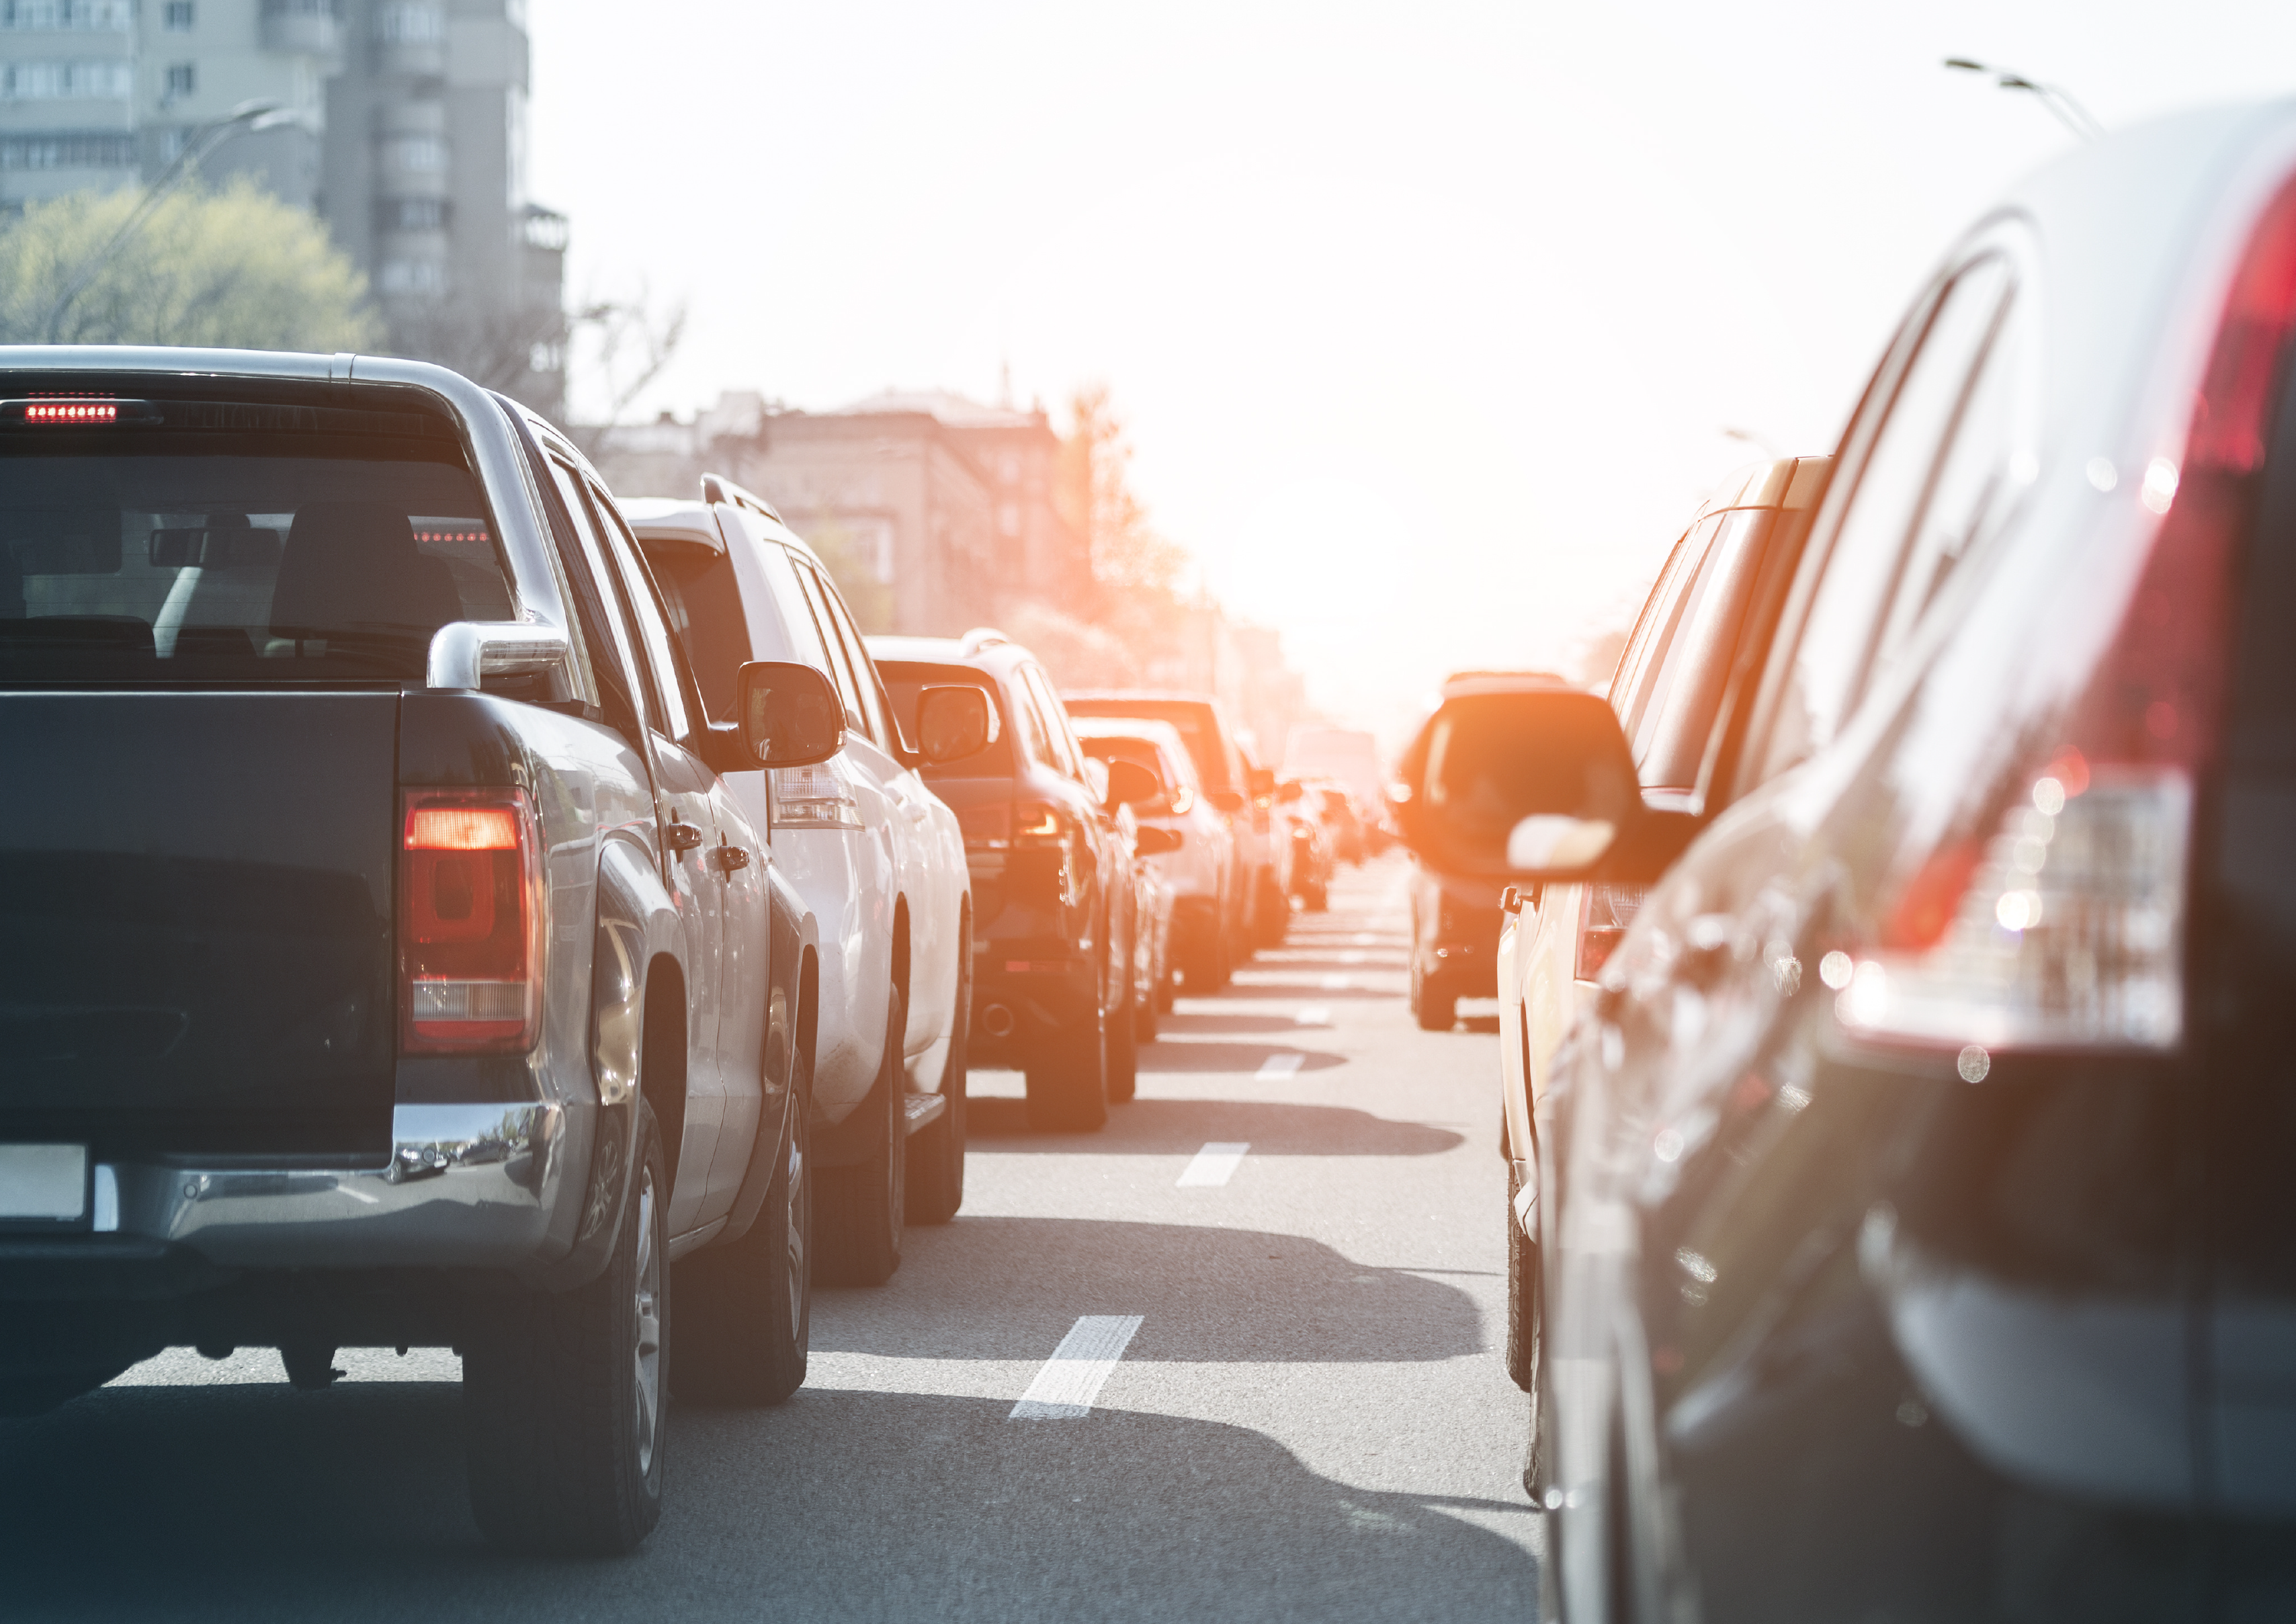
California is famous for congestion
In 2019, data shows us that California led the USA for time spent stuck in traffic, even with public transport servicing a high level of the population.
All of this means: the demand for parking is going to increase as people return to their normal lives, but ditch public transport in favour of more usage of cars.
How does your
parking need to
change to keep up?
All of this data shows that there is going to be a significant increase in people driving, meaning more people parking their vehicle at their destination.
COVID-19 restrictions lifting meaning people can now get back out and about; fewer people using public transport to get there meaning more people travelling to places by car, no longer supplemented by public transit.
If you’re not prepared, this could mean more crippling congestion in your parking lot, leading to a negative first experience when your users arrive.
This may also lead to a reduction in users, as people seek other options or choose to change their behaviour if parking is not accessible enough.
How can you accommodate an increase in parking users, build more parking to keep up with demand?
This comes at a huge financial expense, with construction industry data showing an average cost of $20,000 per space for surface lots and $50,000 per space for a garage or structure, as well as the environmental impact and cost of converting existing space to parking.
You may have enough parking capacity now, it may just not be being utilized to its maximum potential. Without any reliable and accurate data collection tools, it is difficult to truly measure utilization.



Data collected from 100 Cities, Airports, Retail Properties, Universities, Medical Centres, & many other large scale providers of parking with Frogparking occupancy sensors shows that parking lots have hot & cold zones.
With hot zones located near vehicle entries and exits, pedestrian entry and exits, and near elevators if applicable. Cold zones tend to be further and further away from these features.
Data from those same top 100
customers shows that:
The following can increase the utilization of a parking lot and ensure that an entire lot is fully utilized, by directing drivers to underutilized cold zones, rather than constructing more parking capacity.
An accurate parking guidance system
Including a mobile app to display parking availability to a customer before starting their journey
LED indicator lights in driving aisles
& Signage at entries and other key decision points
Data collected from users of transit, who are now more likely to use their car, shows that providing a mobile app for contactless payment options, displaying availability of parking spaces, and to know the COVID-19 protocols beforehand is a large competitive advantage for this user group.
If there is paid parking, the same mobile app displaying availability in a parking lot to those drivers, can process contactless payments, eliminating contact made with the parking meter or booth attendant – further reducing maintenance and overheads produced by both of those methods and providing another advantage to attract this user group over your competitors.
Case Study
The City of Laguna Beach has been a Frogparking customer since mid-2019. The City has over 3,500 parking sensors installed in on-street, off-street, and in parking garages and over 70,000 users of the parking mobile app across iOS and Android platforms.
The app displays the availability of parking around the city, allowing the user visibility of where parking is available before they begin their journey to the city. The app also collects payments, allowing users to skip fumbling coins at the on-street payment machine for a full contactless experience.
Pre-pandemic, in January 2020, the Laguna Beach Parking App had around 35,000. In the time since app users have now doubled to be over 70,000 as people preferred to use a contactless payment option.
