Wondering how you can reduce your carbon footprint with your parking management solution? Look no further, the answer is here … with facts to back it up.
Recently, a customer of Frogparking asked us to commence some work on carbon footprint reductions on their parking asset. They had data available for us from pre-installation of a Frogparking solution, so our data scientists were ‘chomping at the bit’ to get into it.
With a classic kiwi mentality, let’s not beat around the bush.
Frogparking found a significant reduction in carbon emissions. The ‘time to park’ since installation dropped by 75% alone at the parking facility. This means there are fewer people are cruising the parking lot looking for an available parking space. Hence, a reduced carbon footprint.
How did Frogparking make this happen?
Firstly, Frogparking worked with our customer to create a bespoke Mobile Application so drivers could check out parking availability before they even left home. This meant they could go directly to free parking spots, opposed to cruising around looking for that highly prized spot.
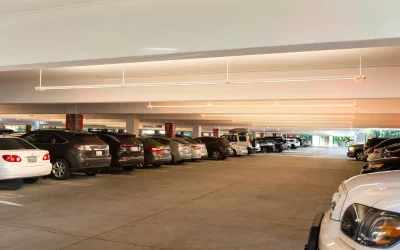
Secondly, Frogparking installed an indoor parking guidance system. This meant that when drivers arrived at the parking facility, they could instantly see where free spots were by the red/green lighting system rail mounted to the ceiling. FrogGuidance is installed using a low-latency network, so updates are in real-time and there is no lag or delay to the lights updating.
Lastly, Frogparking installed dynamic wayfinding signage at key strategic points throughout the parking facility. That meant, as drivers approached the parking lot, they could instantly see what level had free car parking spots. Again, due to the low latency network, this updates in real-time. As cars park, the signs automatically update to reflect the changes in vehicle count.
Cool, but where is the data to support reduced carbon footprint?
The below numbers were collected from FrogHub and compared to previous data supplied to us from our customer. You’ll see our parking system highlights the overall usage increased (due to the user-friendly solution), utilization skyrocketed (as available parking was easier to identify), time to park reduced significantly (less time circling looking for a park) & overall vehicle emission also reduced significantly.
| July 2019 | July 2022 | Increase/decrease | |
| Total occupancies | 197,000 | 218,000 | +7.6% |
| Average utilization | 42.7 | 60.4 | +17.63% |
| Minutes to find a parking space | 8 | 2 | +75% |
| Vehicle emissions | 2680 | 670 | -75% |
*July was chosen as the example as it is one of the busiest months of the year for the parking facility
*Data collected by Frogparking on ‘time to park’ is based on geofence and mobile app data from the customer
*Vehicle emissions calculation is based on the output of the median vehicle emissions scale in California measured in grams of CO2 per mile, combined with the recorded reduction in time to park
We feel it is important to note that the ‘time to park’ reduction can also be attributed to an increase in vehicles utilizing the parking facility. This increase is because, for the first time, drivers were able to check the app and see the availability and drive directly to the available car parks.
In conclusion, you can see the above data to support a reduced carbon footprint with a Frogparking solution. For more data like this, and available directly from FrogHub, please reach out to hi@frogparking.com and the team can send you as much/little data as you like.


0 Comments